How It Works
Welcome to IntuiData – your interactive machine learning assistant. Follow these simple steps to get started.
See IntuiData in Action
1. Sign Up or Log In
Sign up or log in now to gain instant access to our interactive Playground, where you can explore your datasets and harness our powerful AI Assistant for both exploratory data analysis and machine learning model training.
2. Dataset Explorer
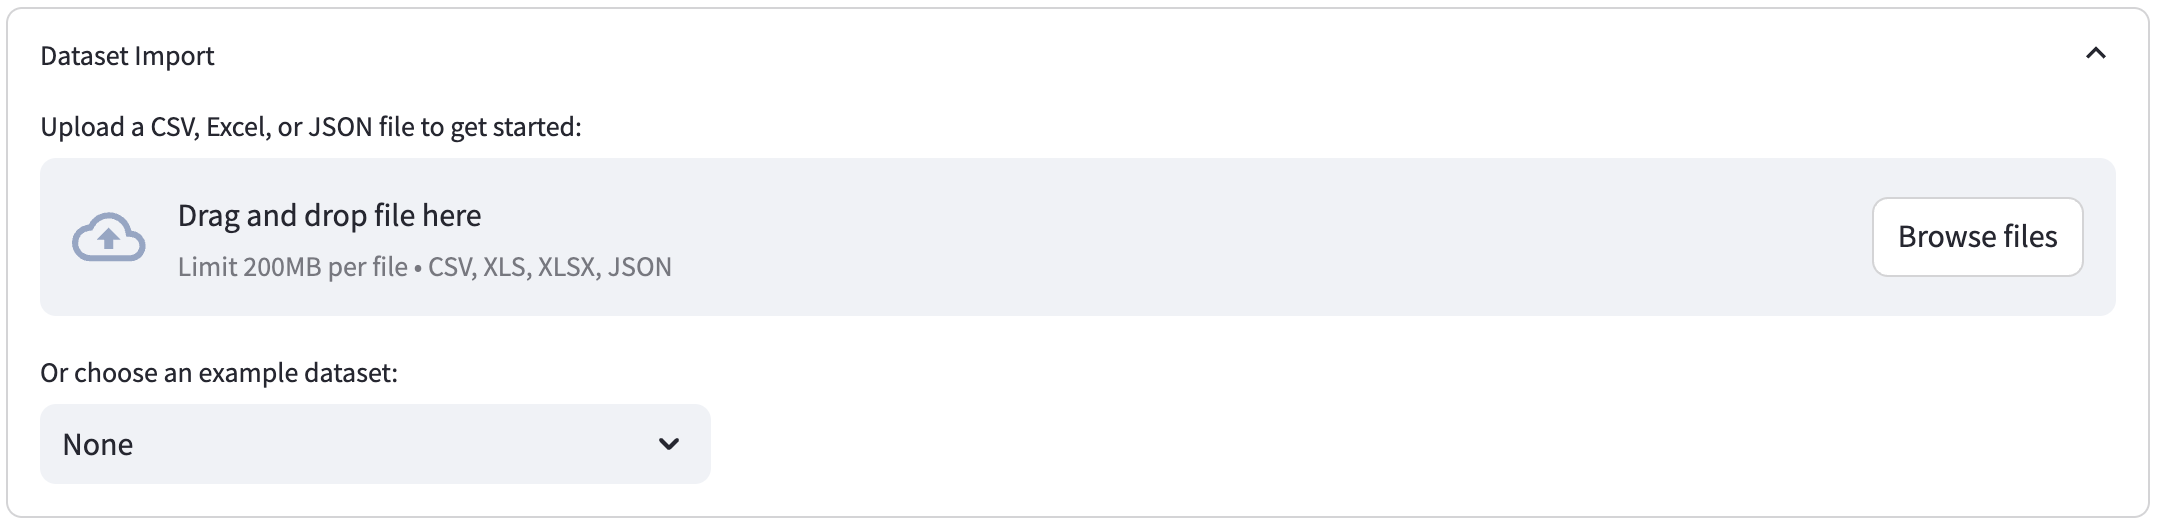
Import or choose a dataset
Upload Your Data
Bring your own data by uploading CSV, Excel, or JSON files.
Use an Example Dataset
Not sure where to start? Pick from our curated sample datasets.
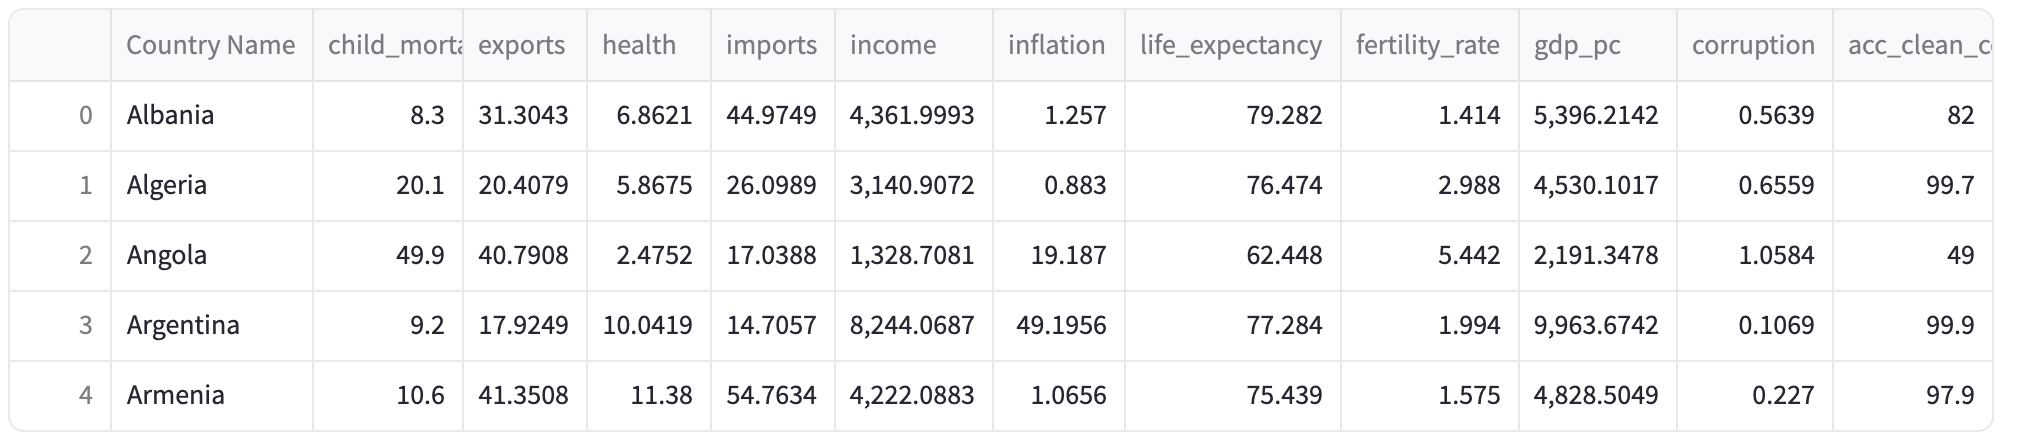
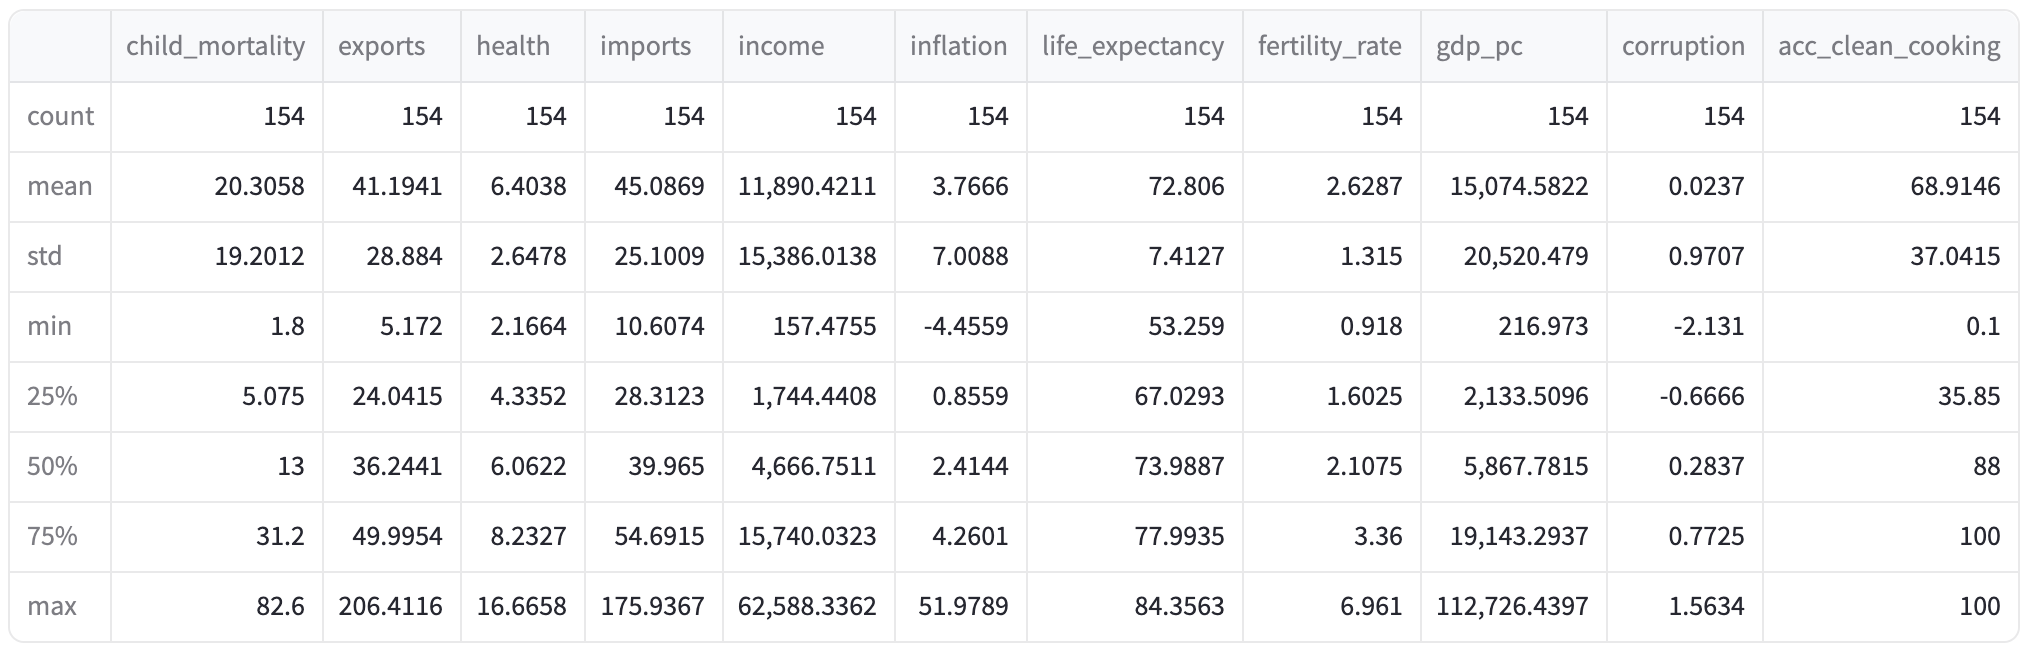
Preview and Explore
Once you've uploaded or selected a dataset, view a preview of your data along with key statistics and insights to help you understand its structure and quality.
3. AI Assistant
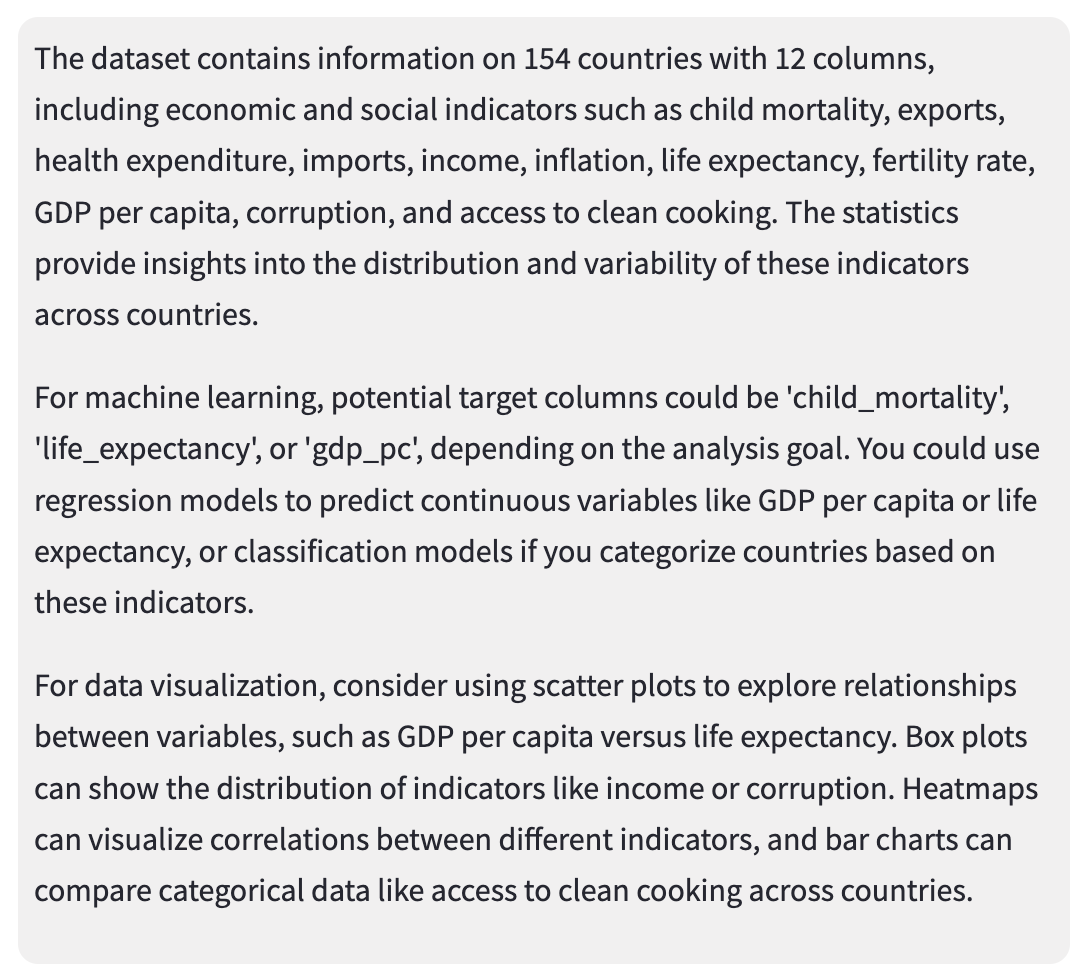
Initial Analysis
The AI Assistant quickly analyzes your dataset, highlighting trends and providing recommendations on visualizations and machine learning techniques.
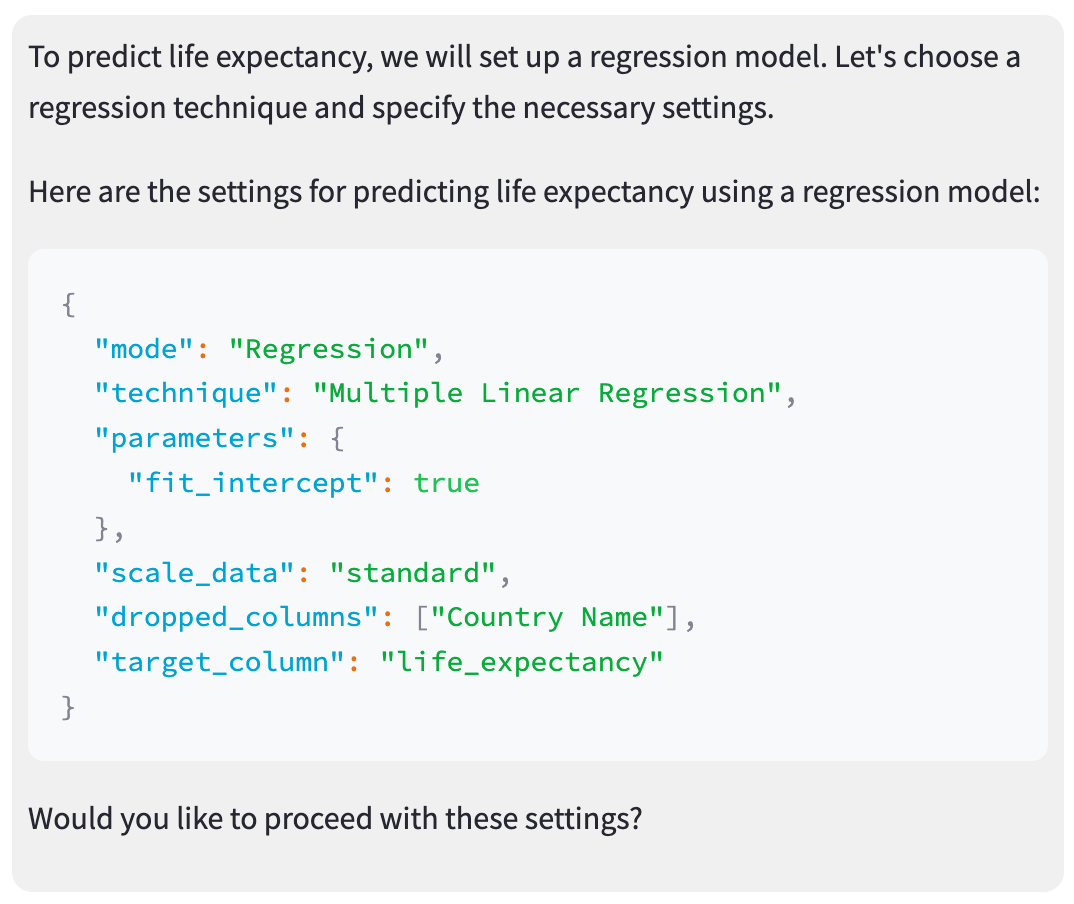
Interactive Setup
Use the chat assistant to easily configure your machine learning training parameters and refine your visualization settings. Ask questions and receive immediate, practical advice through interactive chat.
Instant Feedback
Get immediate feedback on your data visualizations and ML model performance to iterate and improve in real time.
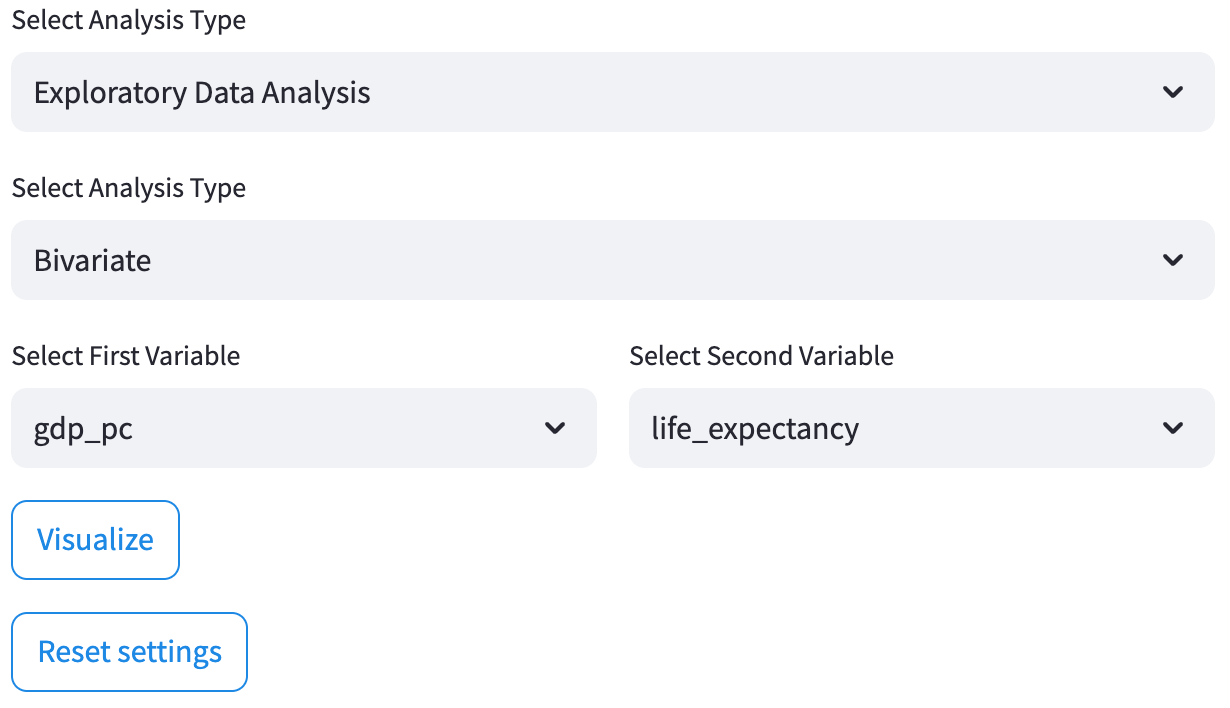
4. Settings
Customize your experience
EDA Options
Adjust visualization settings to best represent your data.
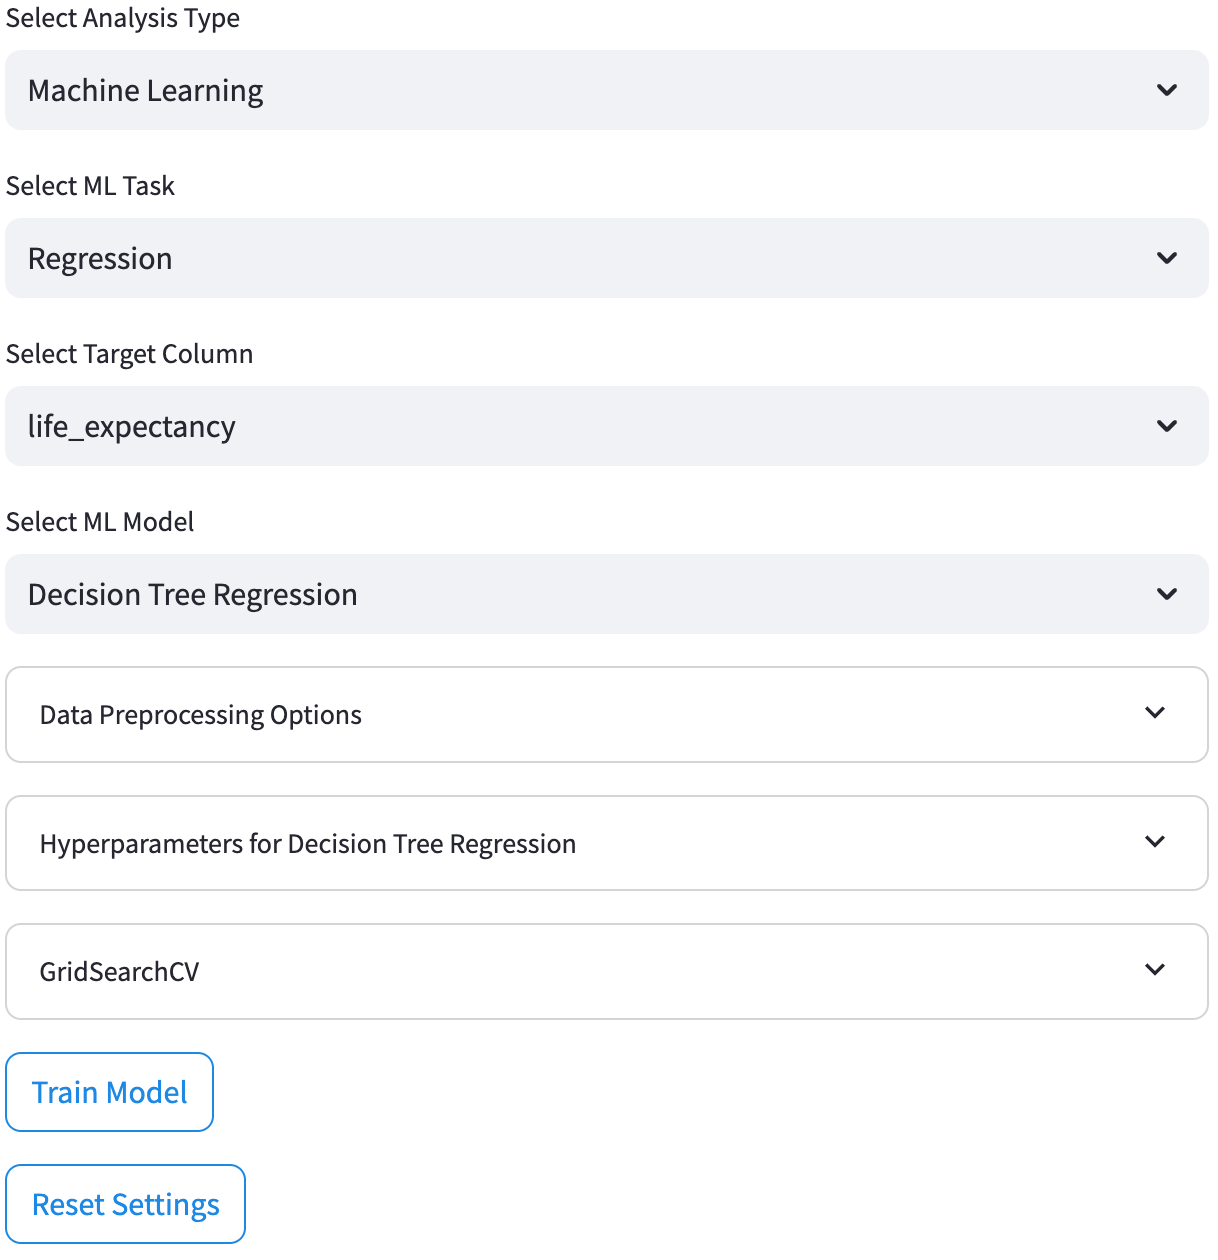
ML Training Parameters
Fine-tune machine learning settings to match your specific requirements, ensuring optimal model performance.
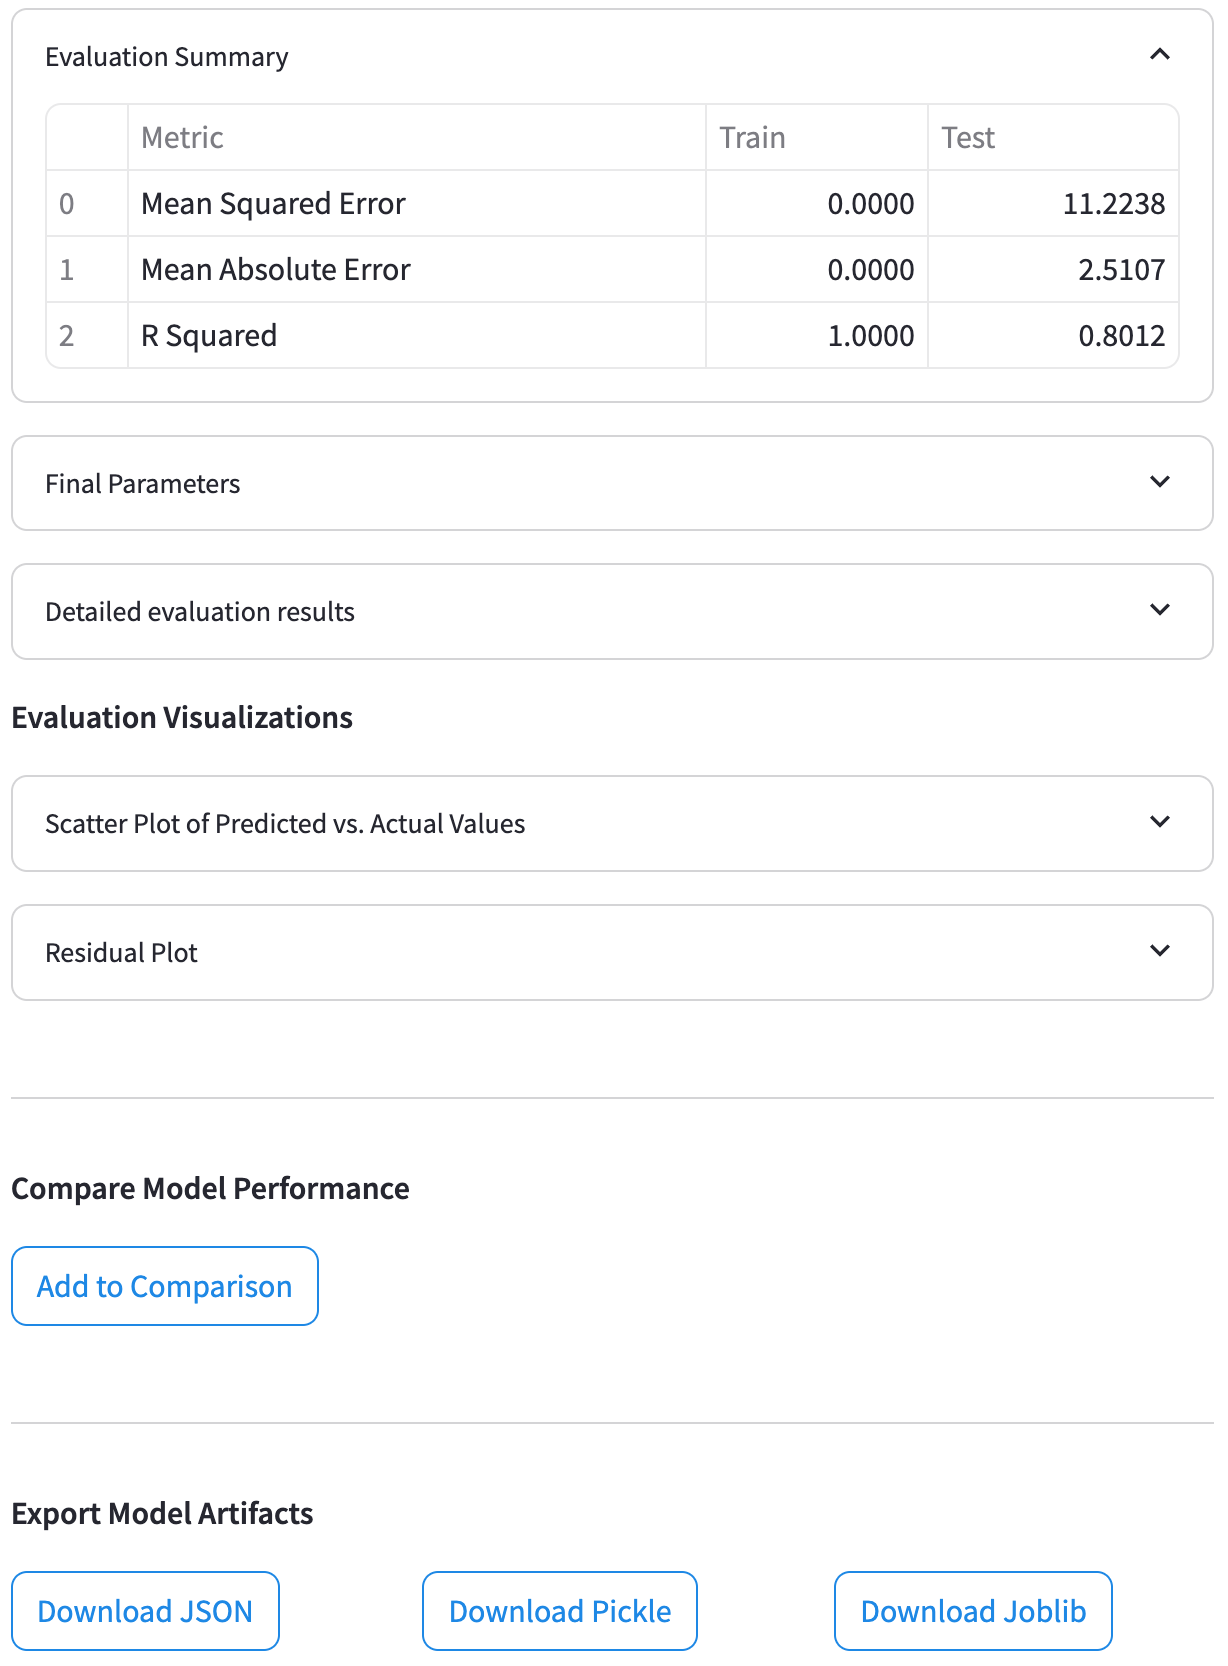
5. Evaluation and Visualizations
Deep dive into your results
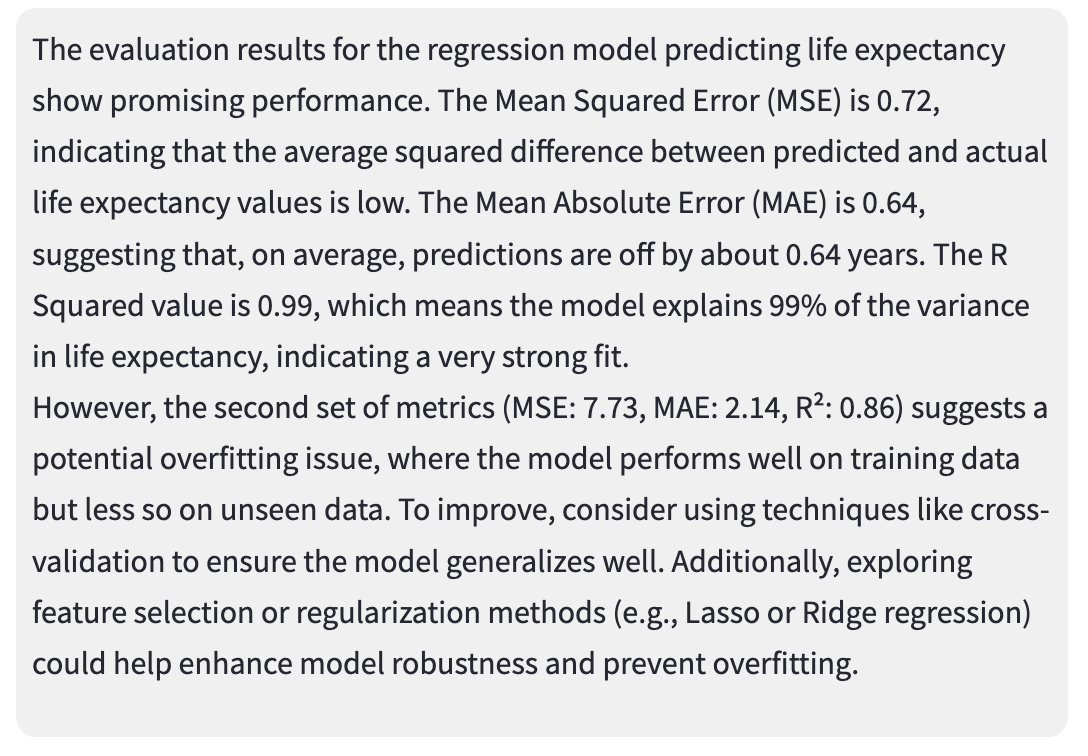
Comprehensive Evaluations
Access detailed evaluation reports for your trained models, including performance metrics and comparisons with alternative models.
Download Model Artifacts
Export your model artifacts and evaluation results in multiple formats for further analysis or reporting.
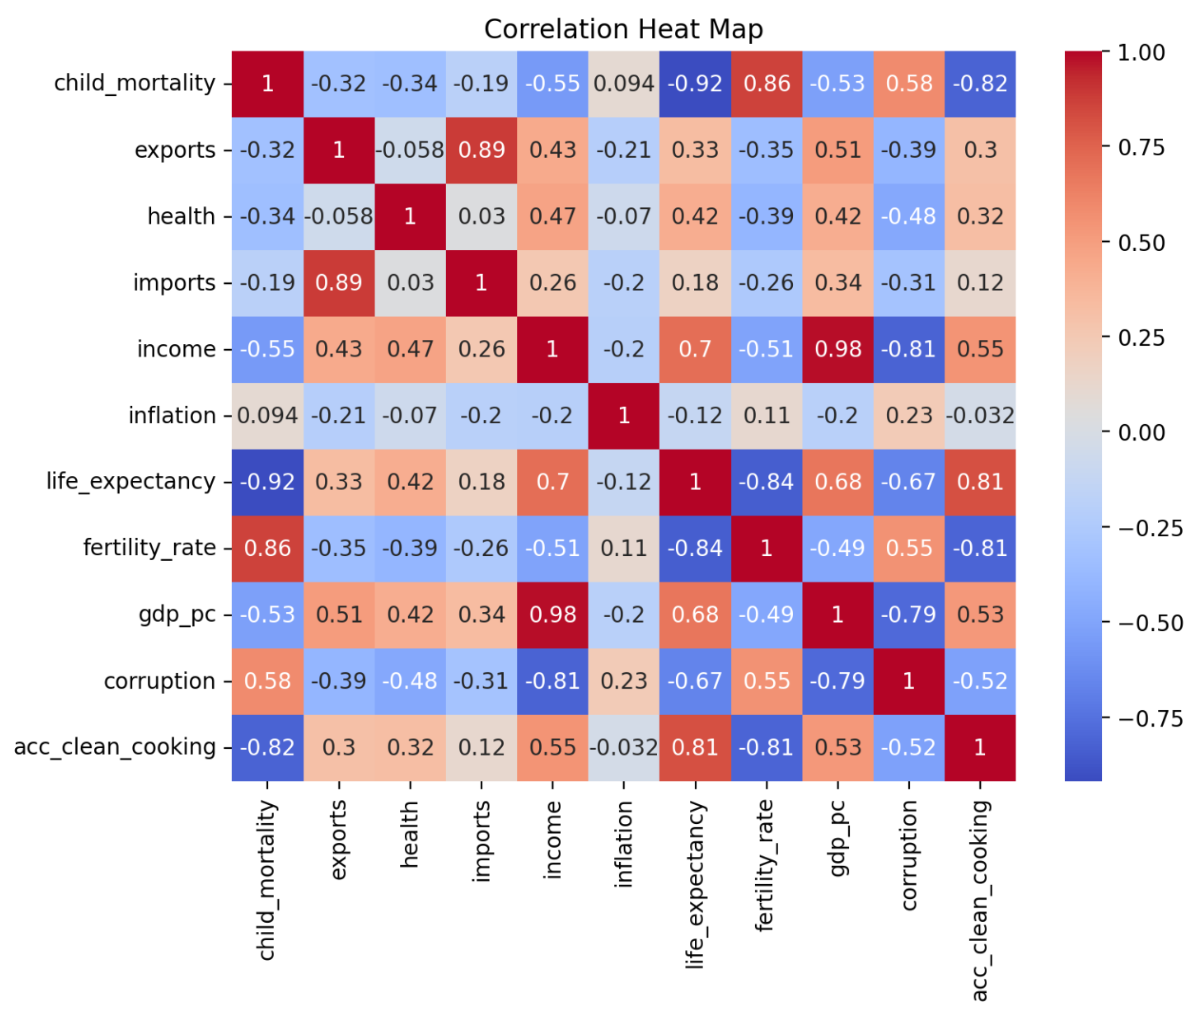
Rich Visualizations
Explore a variety of visual outputs such as plots, histograms, heat maps, and more.
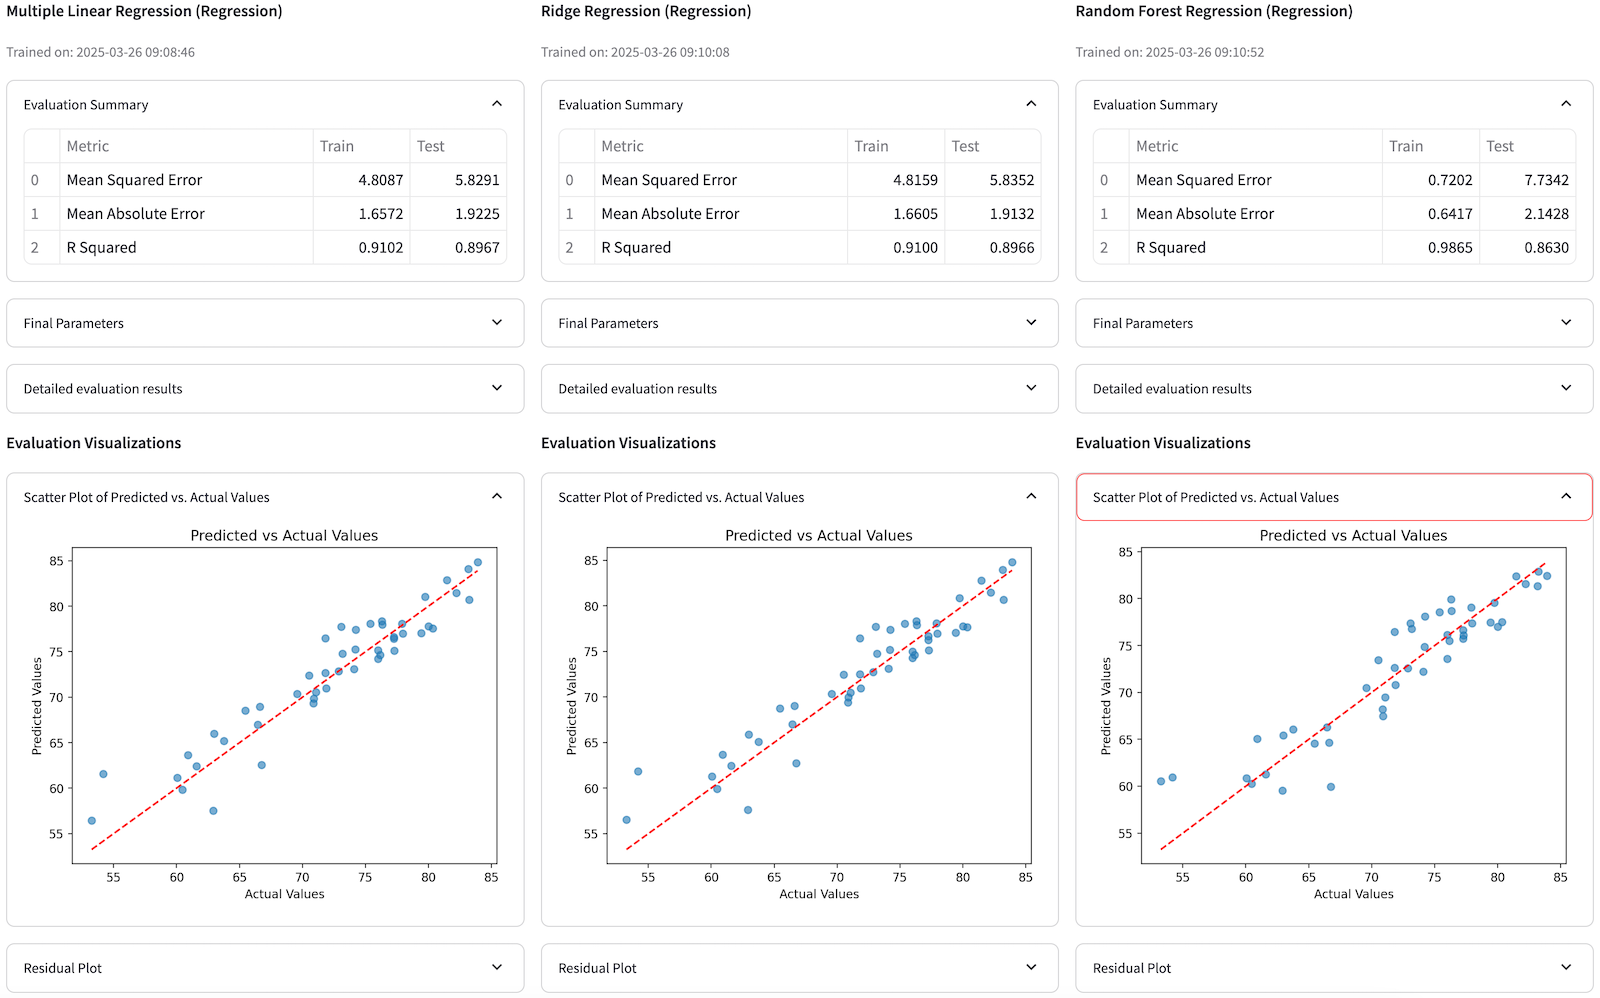
6. Benchmarking
How to Benchmark Machine Learning Models
Train Multiple Models
Try different algorithms on the same training data.
Evaluate & Visualize
Compare ML models using key metrics and simple plots to spot strengths and weaknesses.
Compare & Choose
Select the model that balances accuracy, generalization, and interpretability based on your project goals.